Overview
Skills Learned
UX Research, Prioritization, Wireframing, Prototyping, Competitive Benchmarking, Usability Testing
Tools
Microsoft Excel, Figma
User Research: Summary
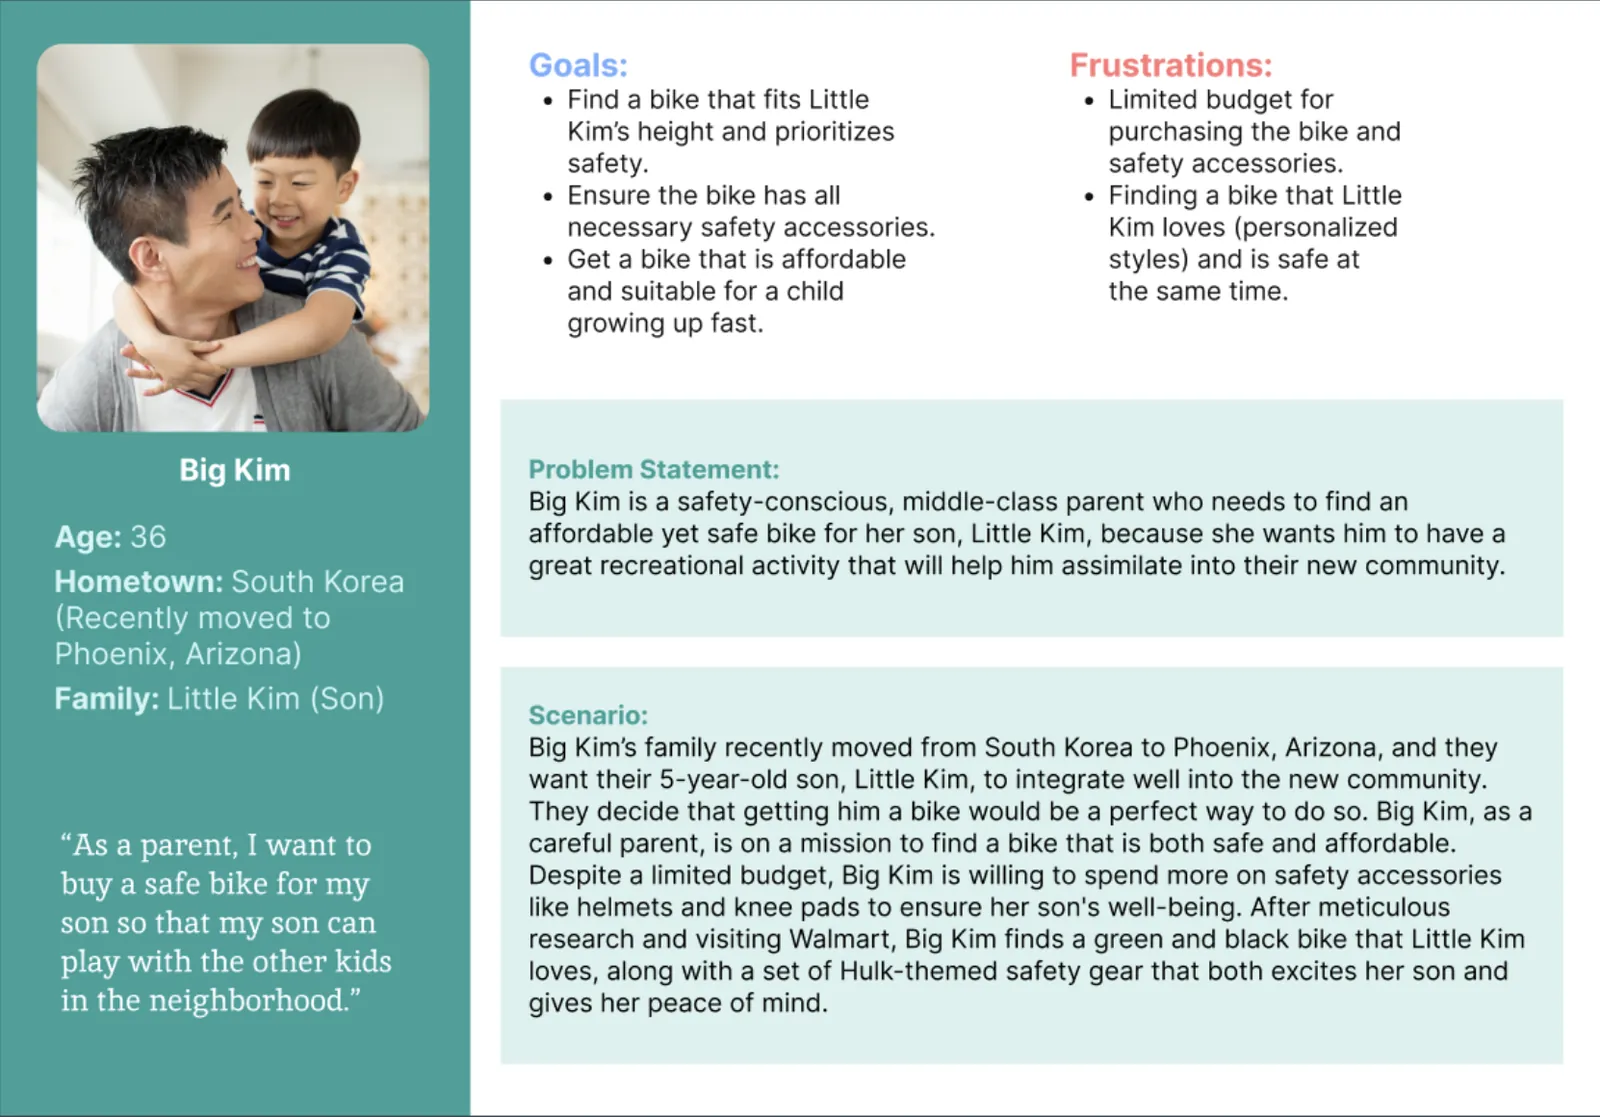
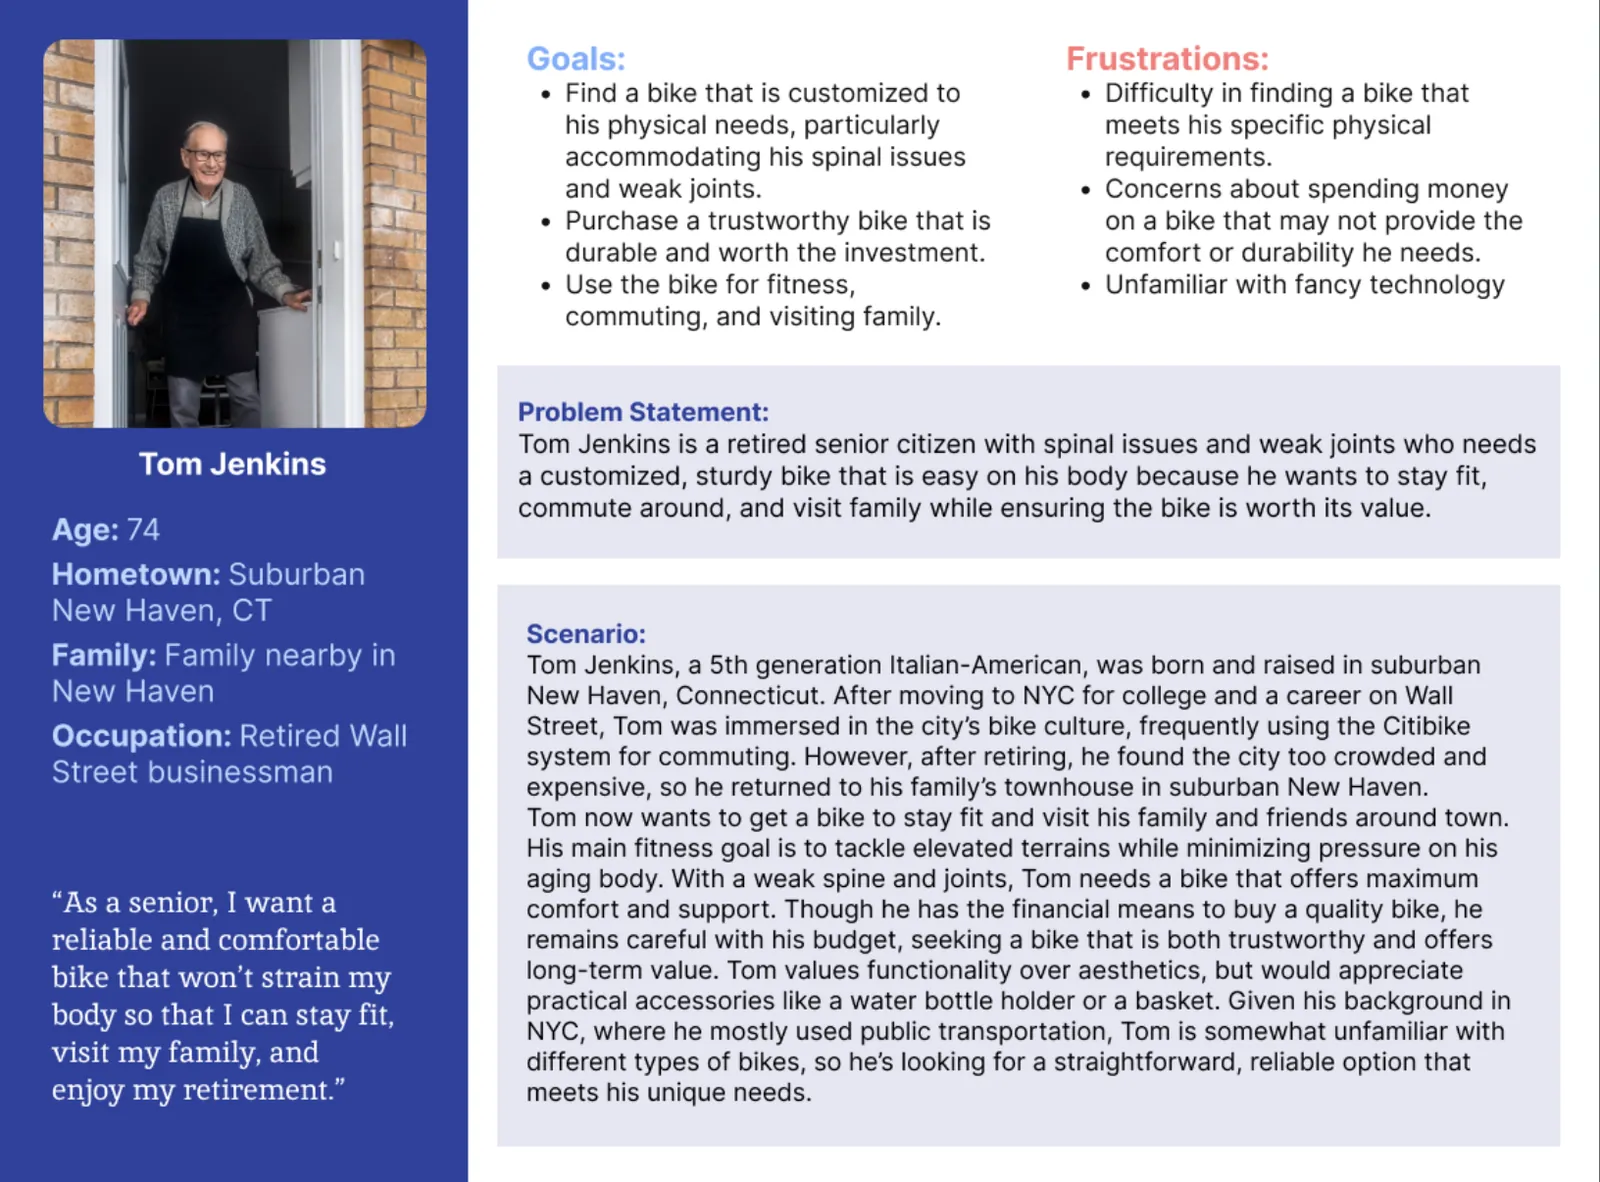
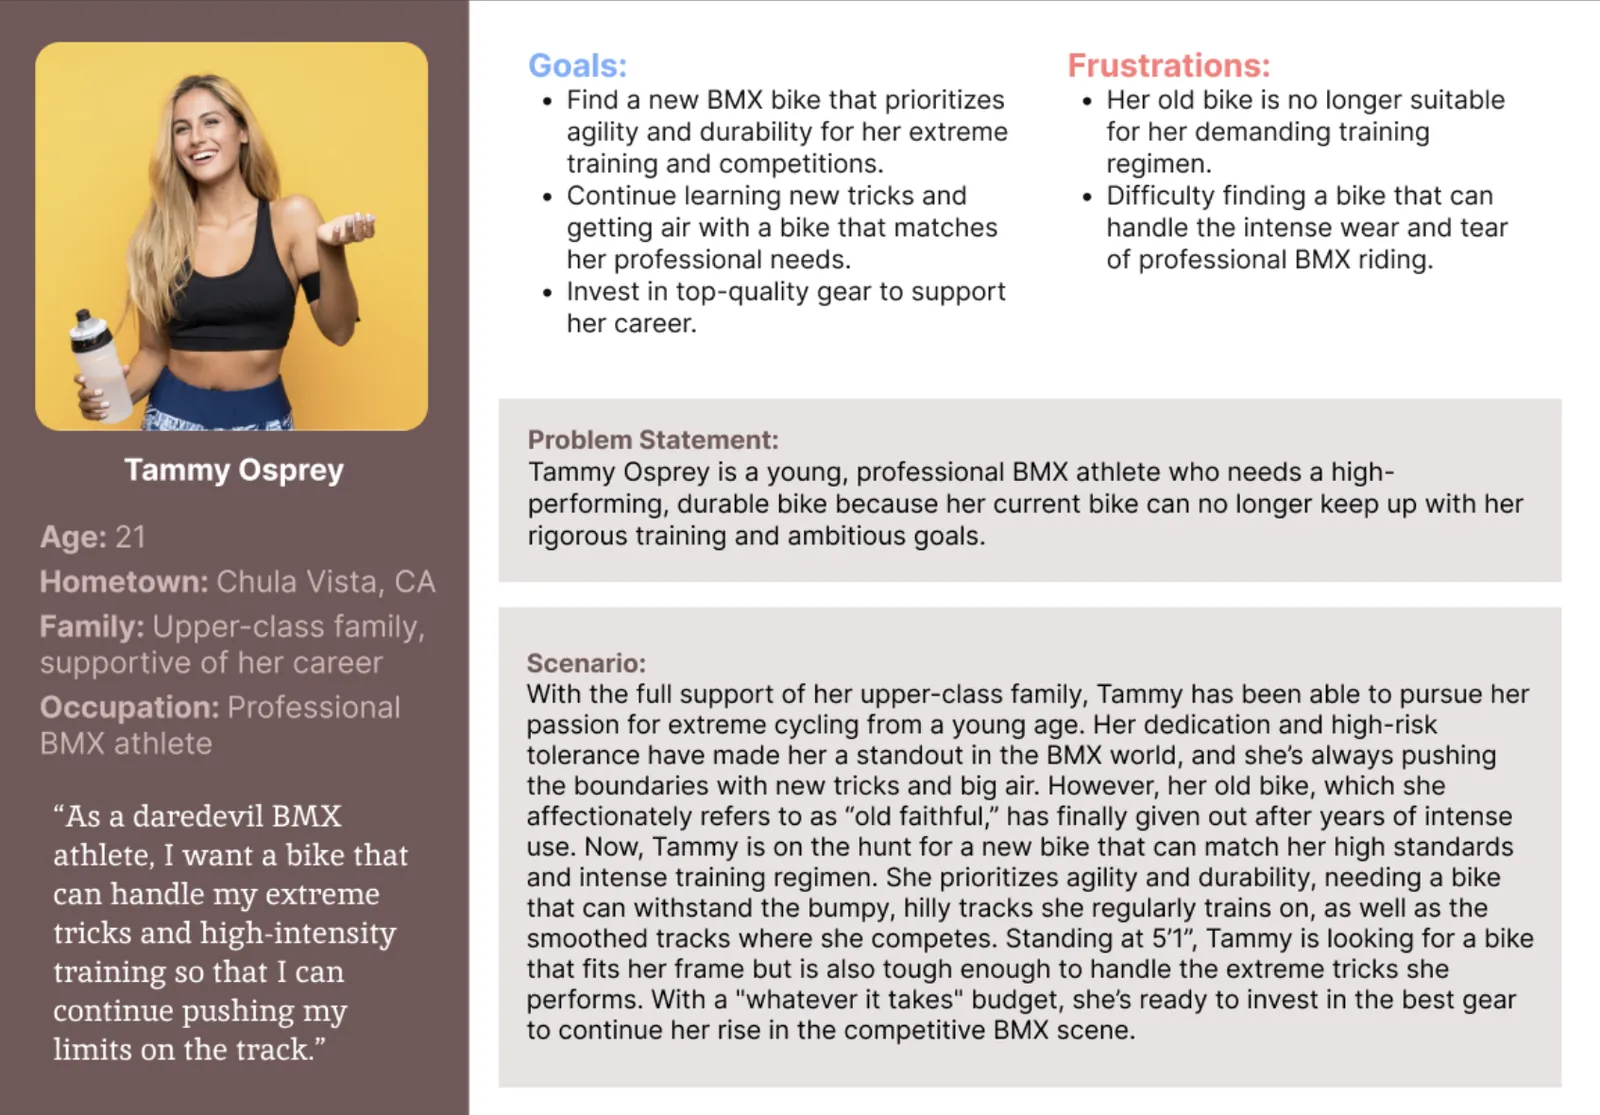
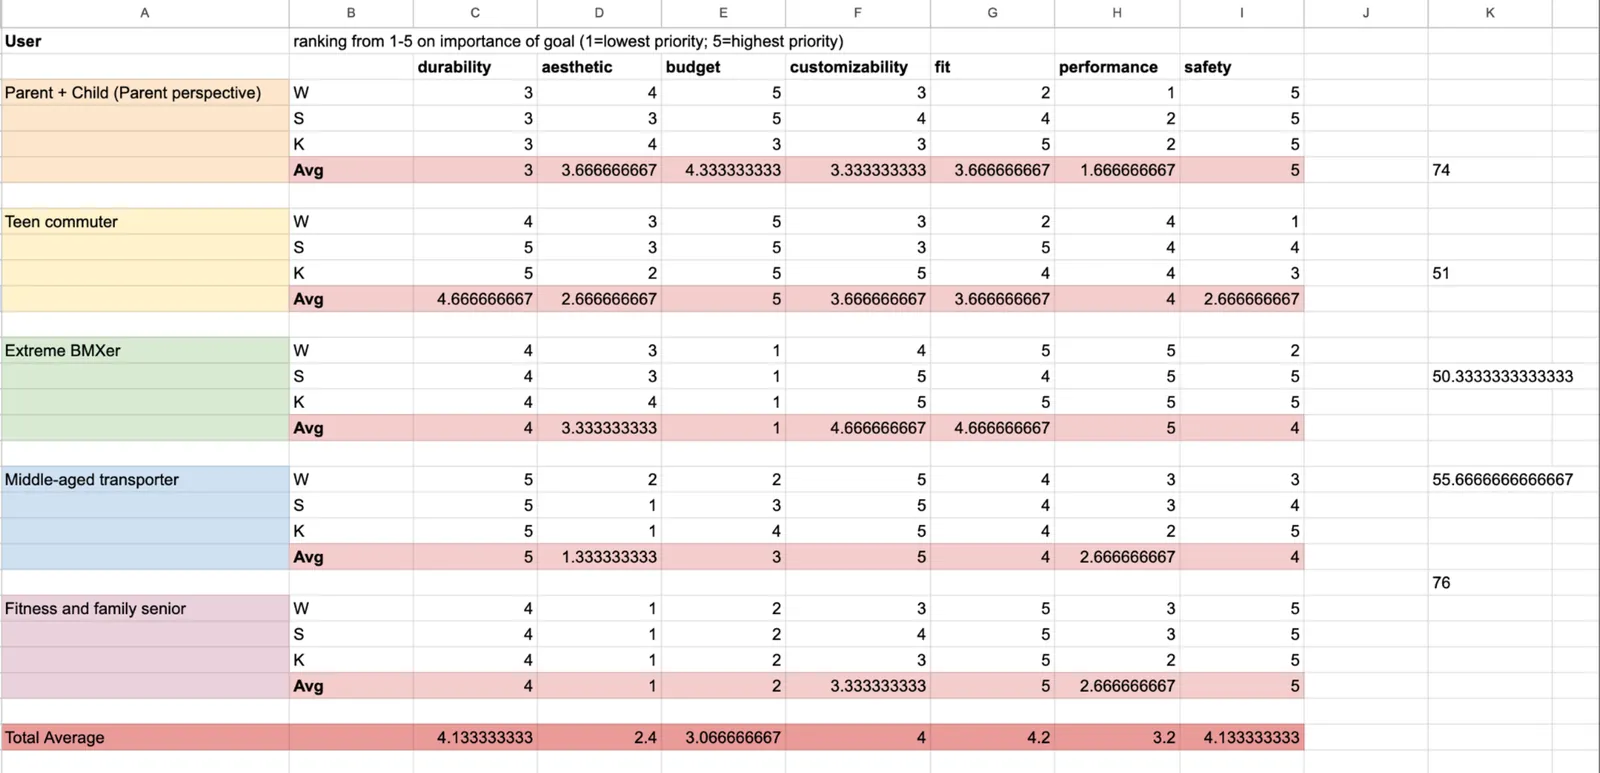
In this project, I conducted comprehensive user research to understand the varied needs of different cycling personas. Initially, I assumed that budget and basic functionality would be the primary concerns for most users. However, the research revealed that priorities differ widely based on biking experience, fitness goals, and specific use cases. This insight led to a more nuanced approach, emphasizing customized recommendations tailored to each user's unique traits, such as physical condition and terrain preferences, rather than just focusing on cost.
User Persona Development
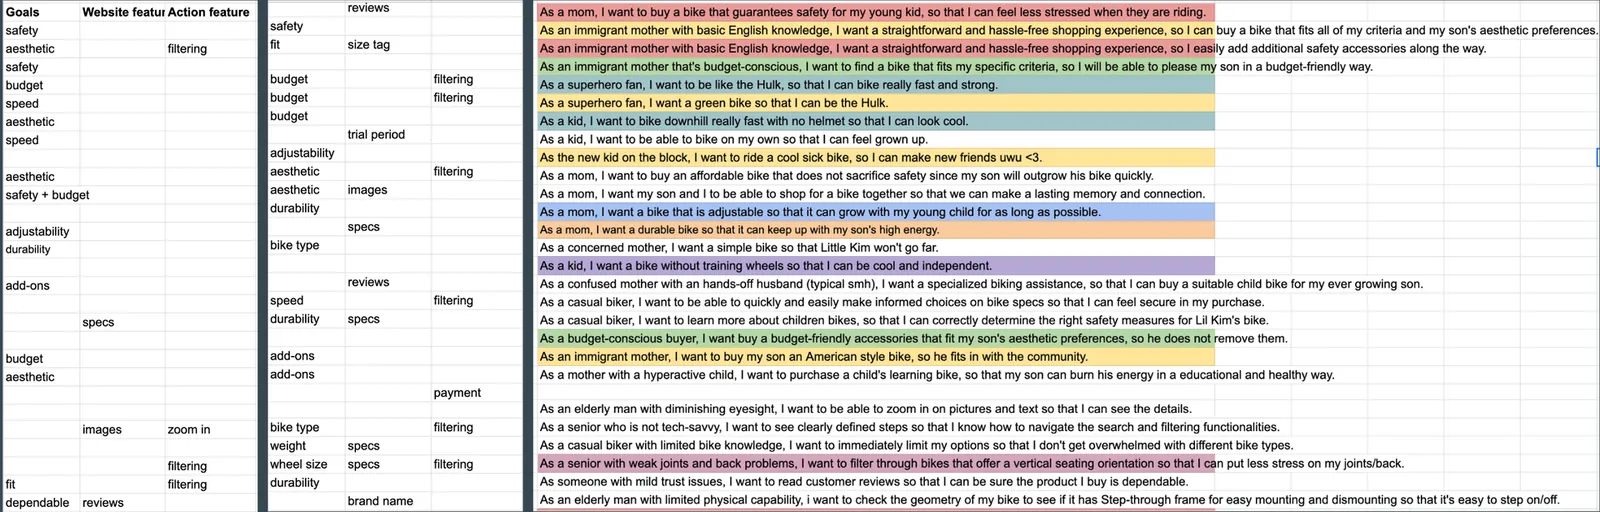
User Story Analysis
Open the user story analysis sheet ↗
User Research: Scoring
Usability Study: Findings
I conducted two rounds of usability testing on both low-fidelity and high-fidelity wireframes to evaluate user interactions with the proposed UI designs. The goal was to identify areas where users faced confusion or difficulty and to refine the design to better meet their needs.
UX Strategies for Simplifying Bike Selection
This section highlights key design decisions made to support accessibility, reduce decision fatigue, and help users confidently find a bike that fits their needs.
High-Fidelity Prototype
Open the high-fidelity prototype in Figma ↗
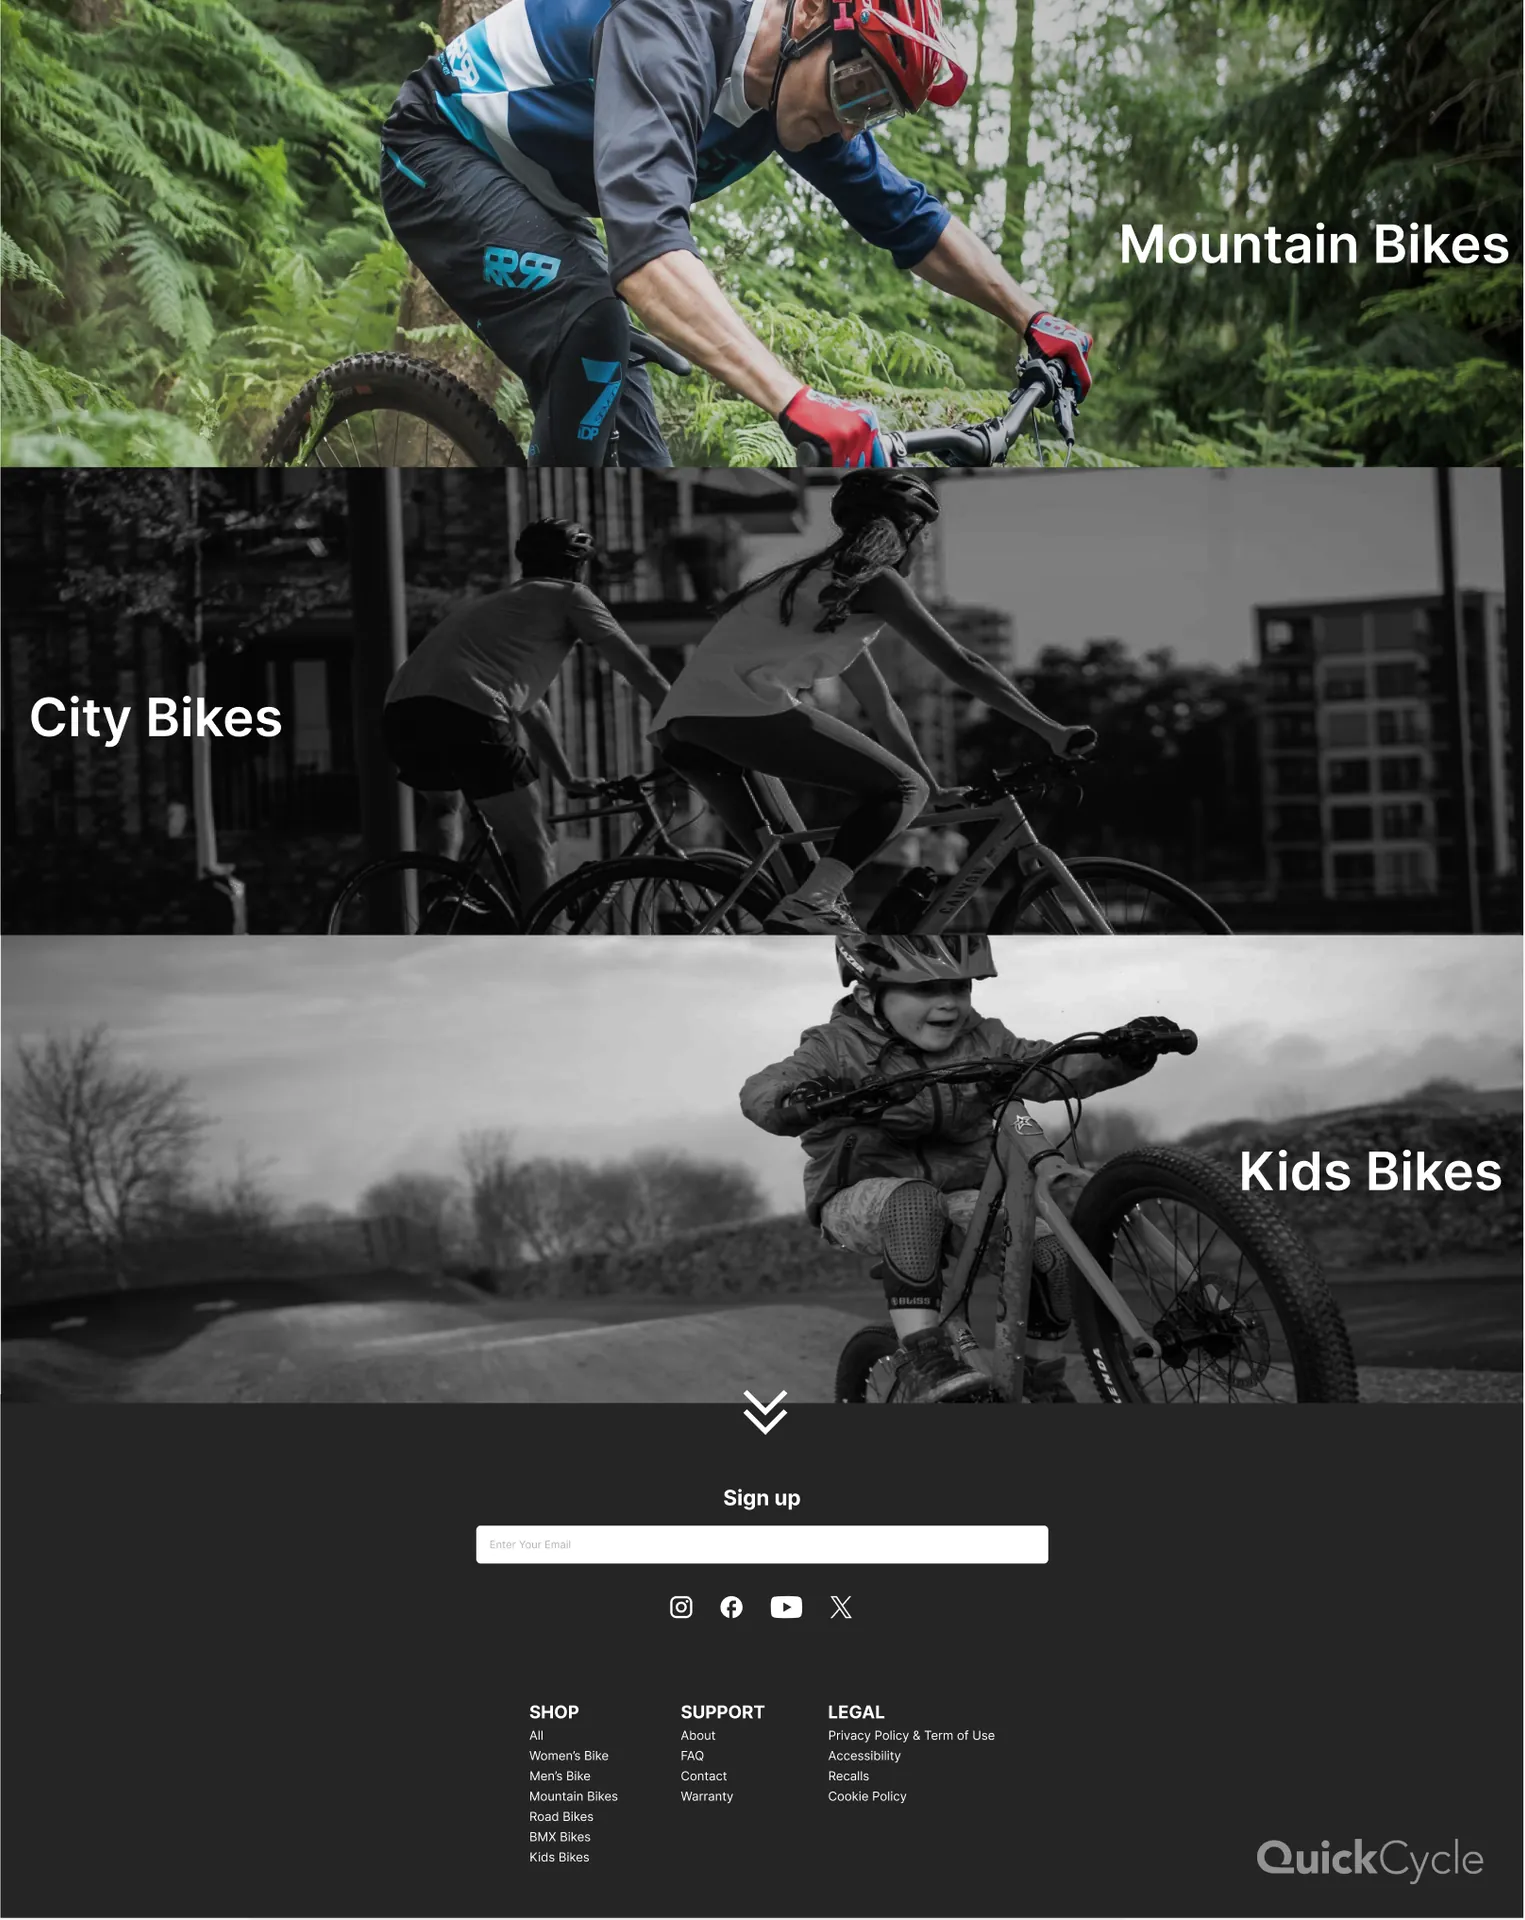
Homepage
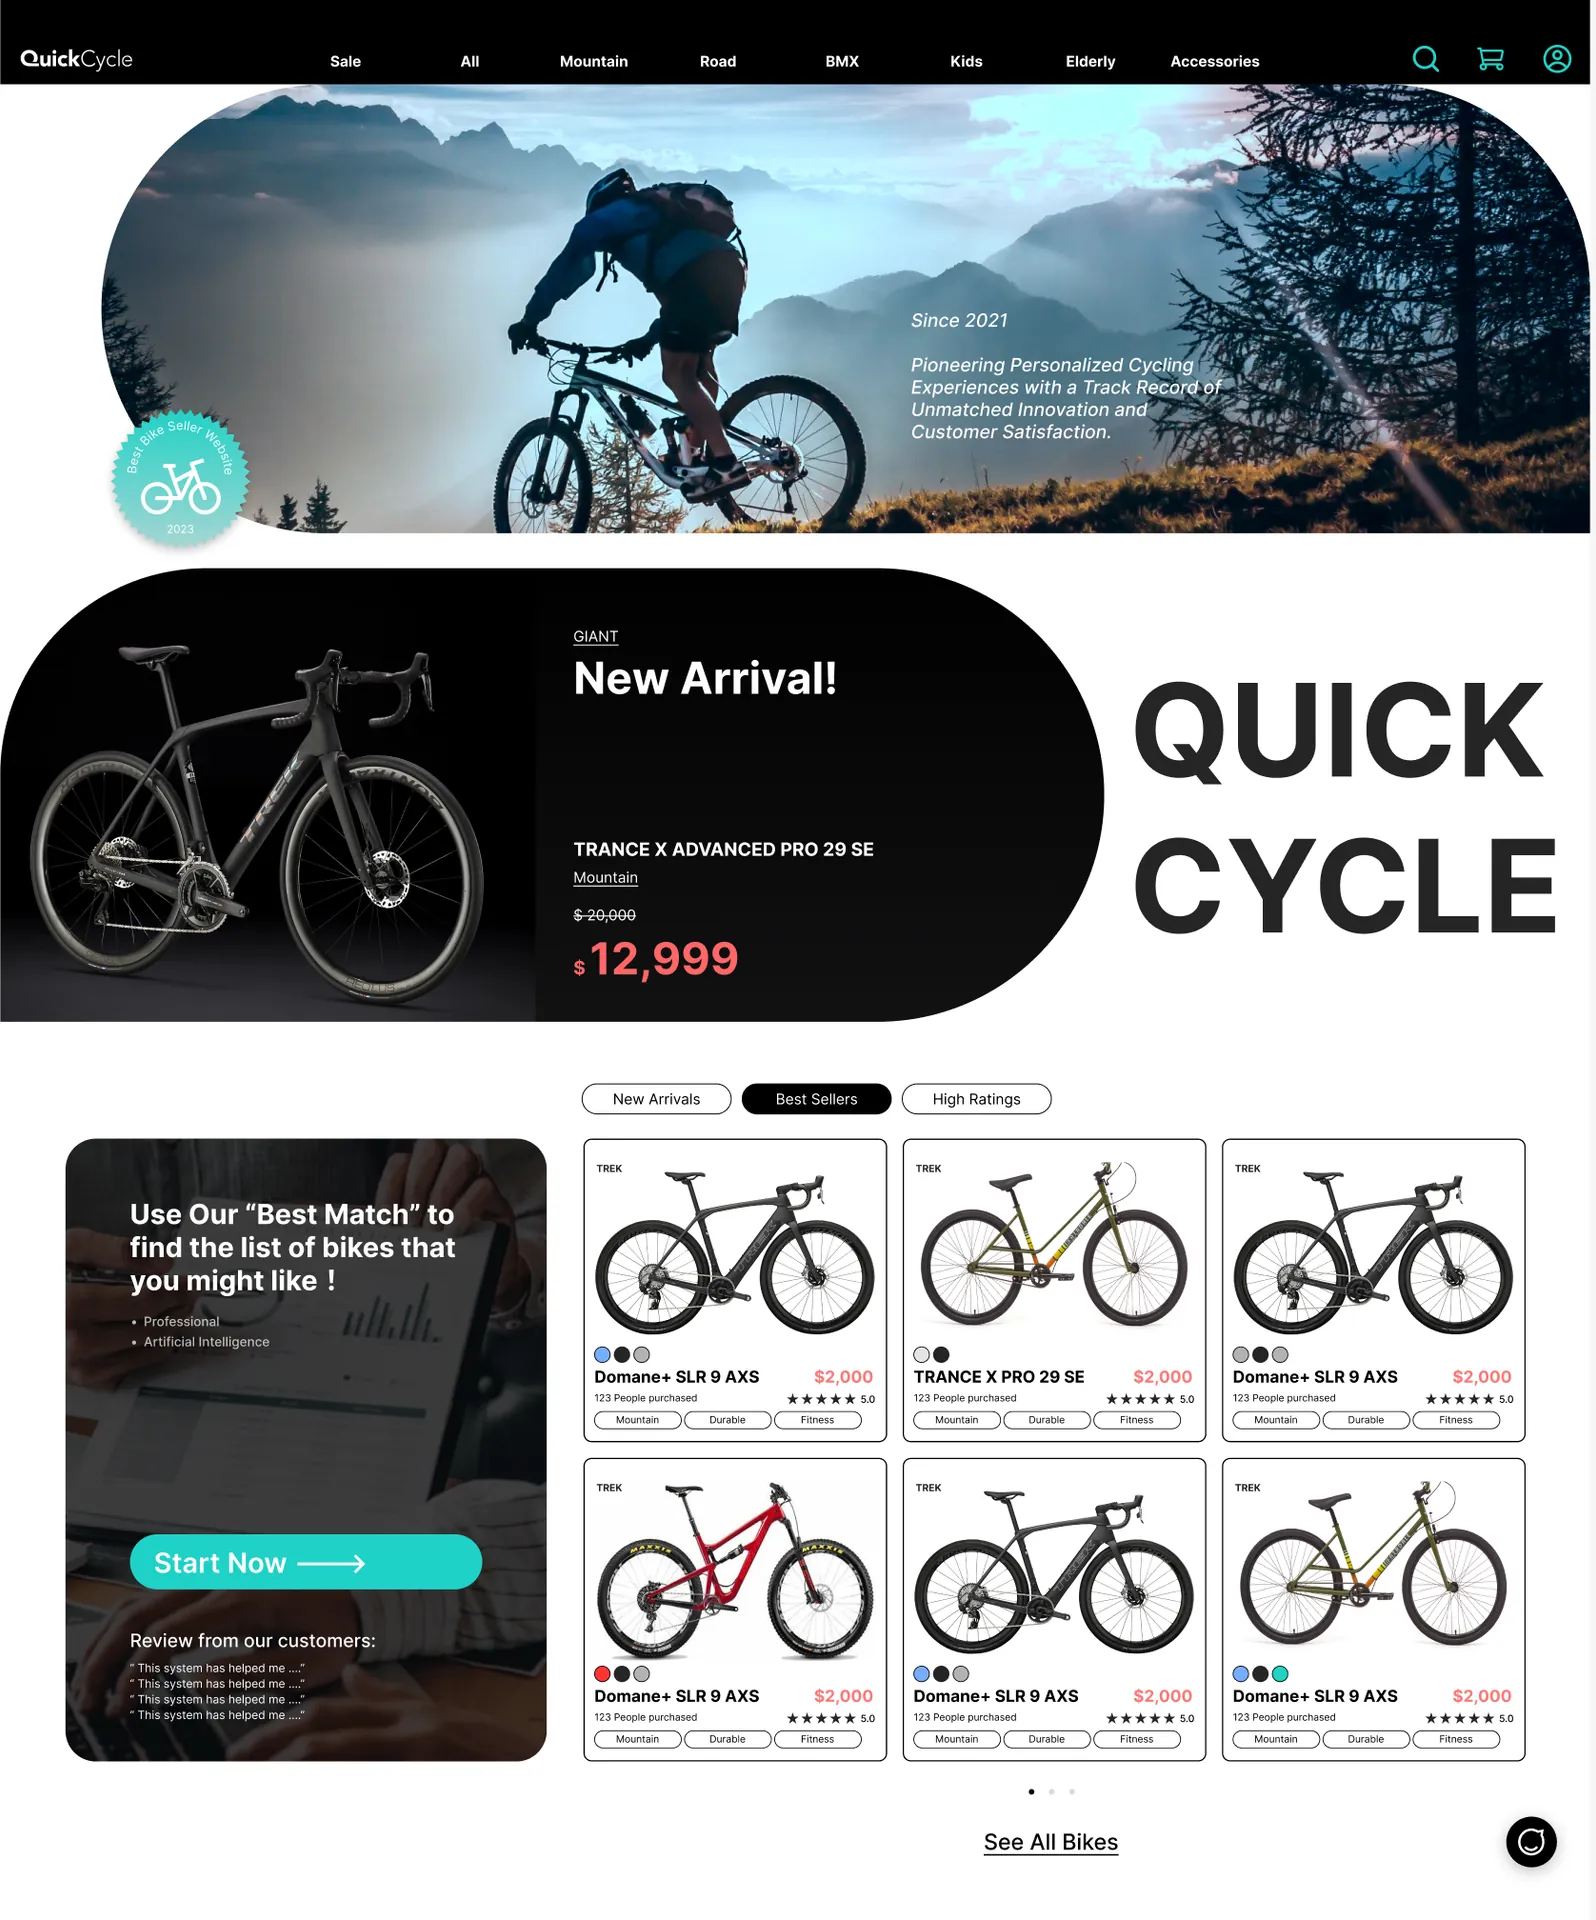
- Guided onboarding via survey entry
- Early trust-building with customer feedback
- Consistent visual hierarchy for scannability
- Low-friction promotion placement
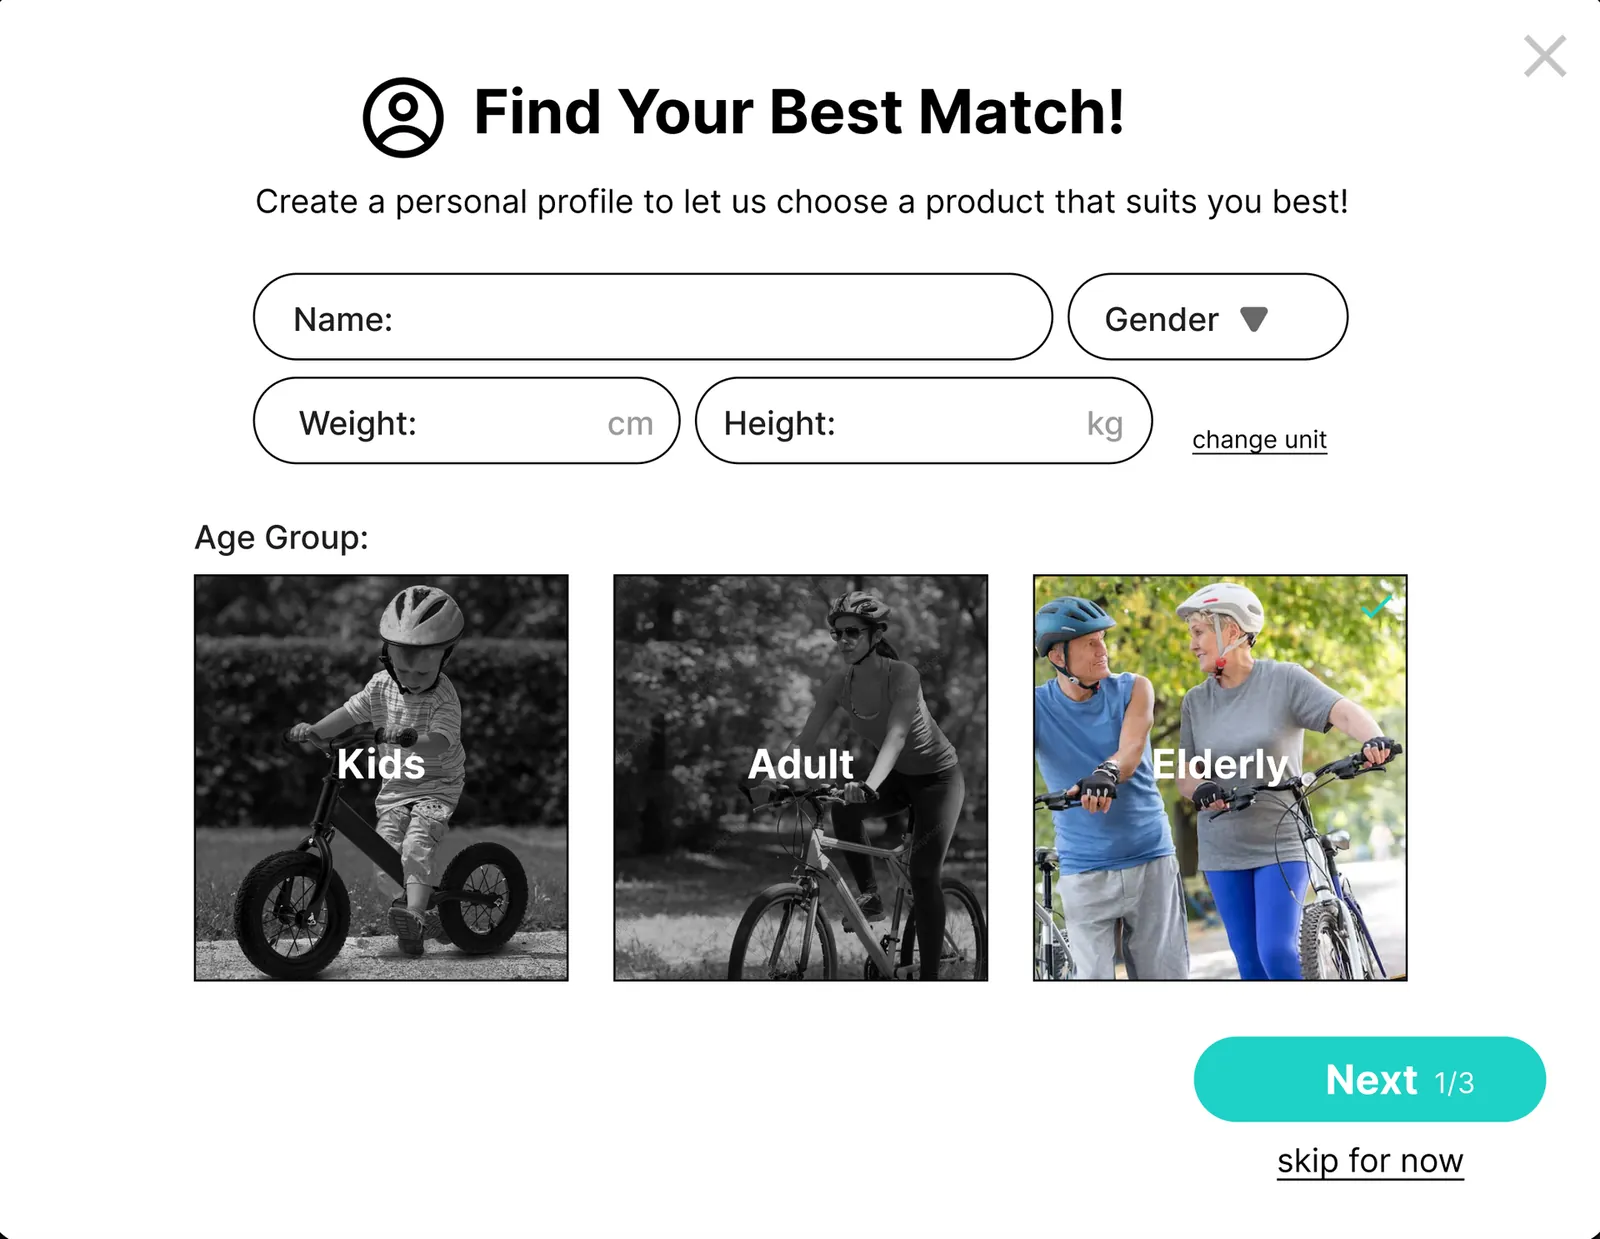
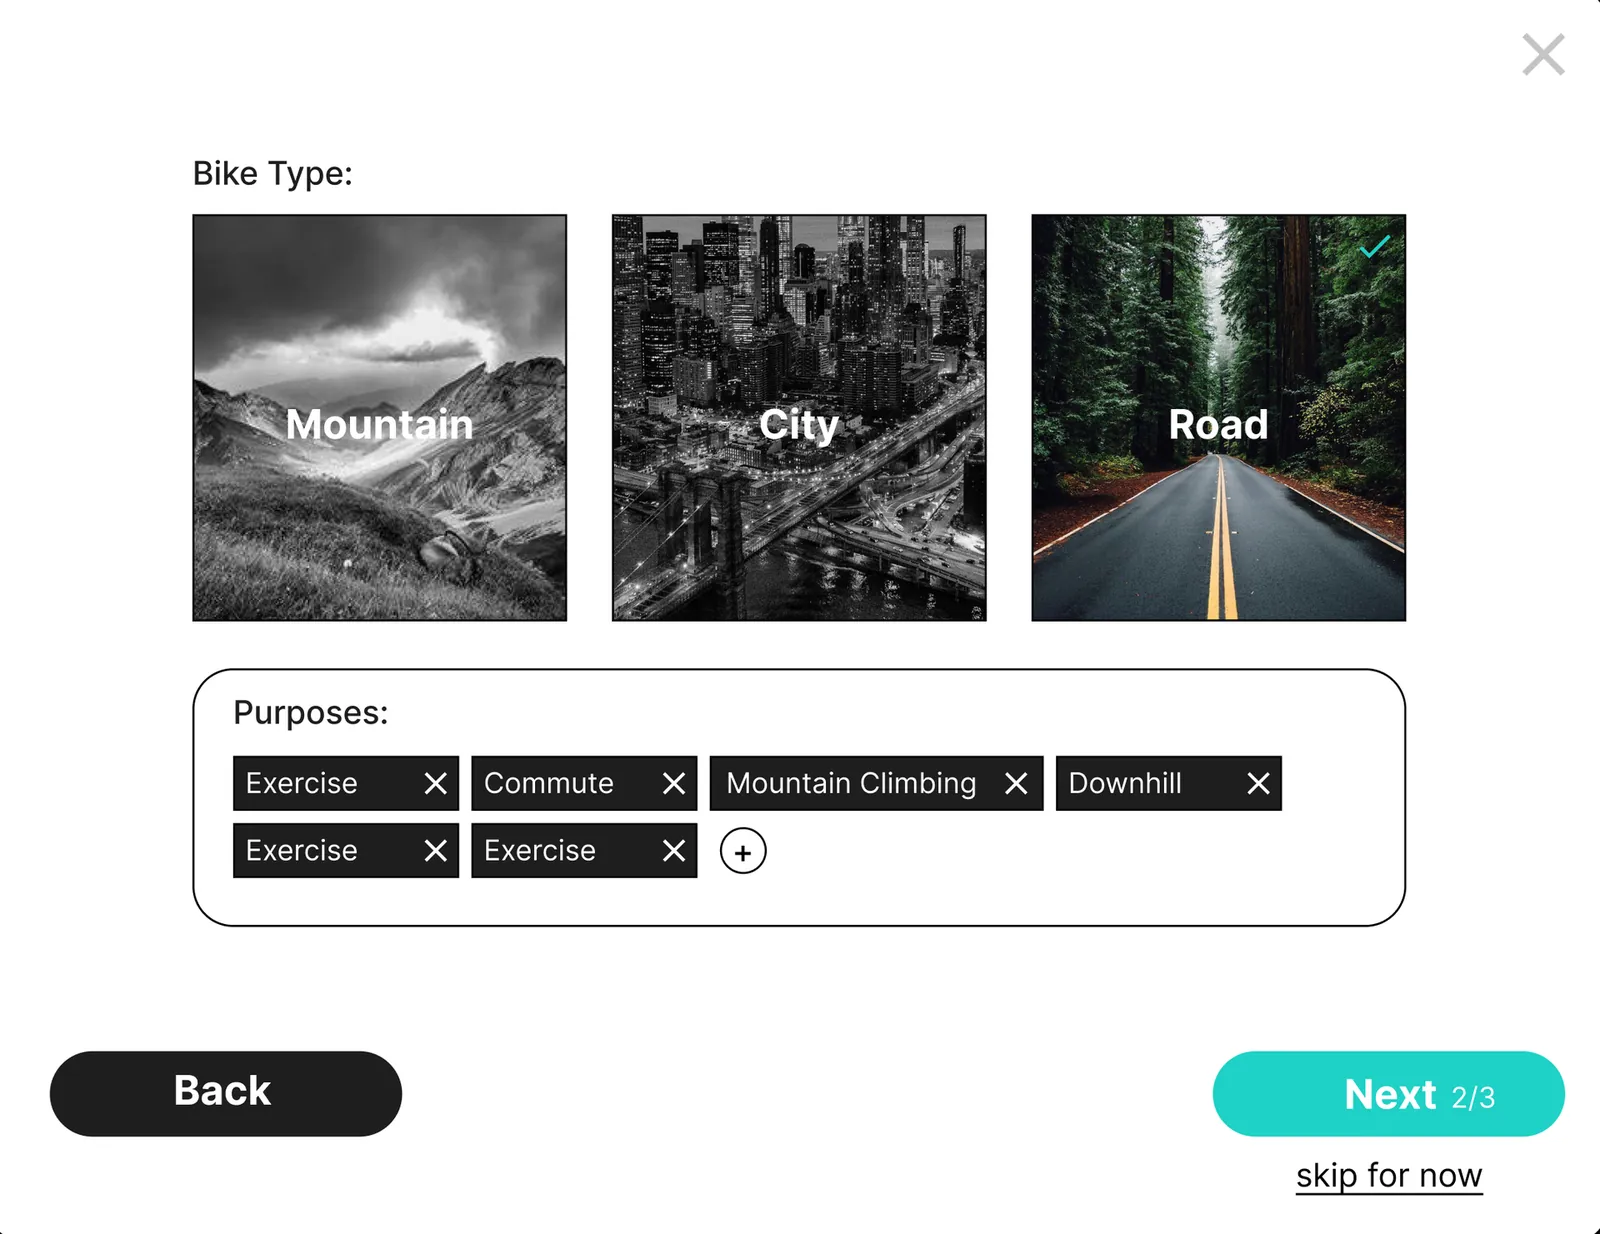
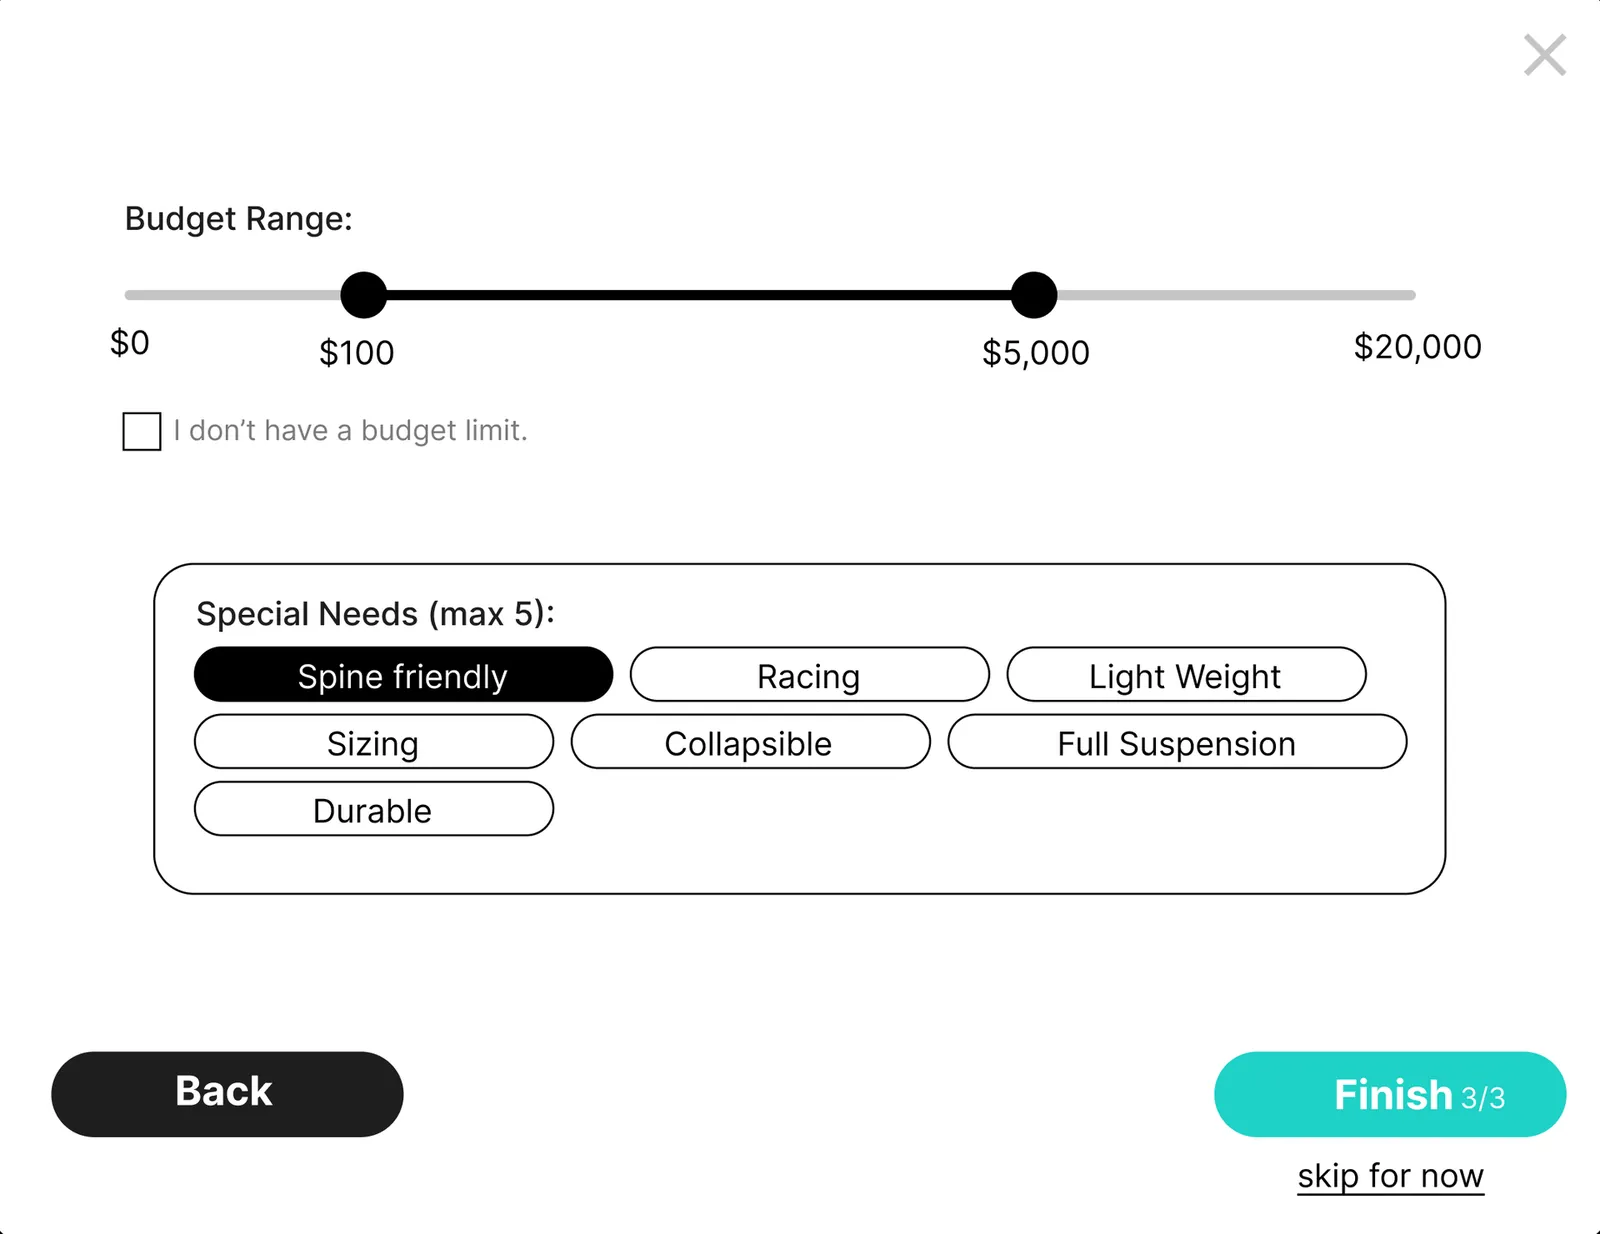
Survey
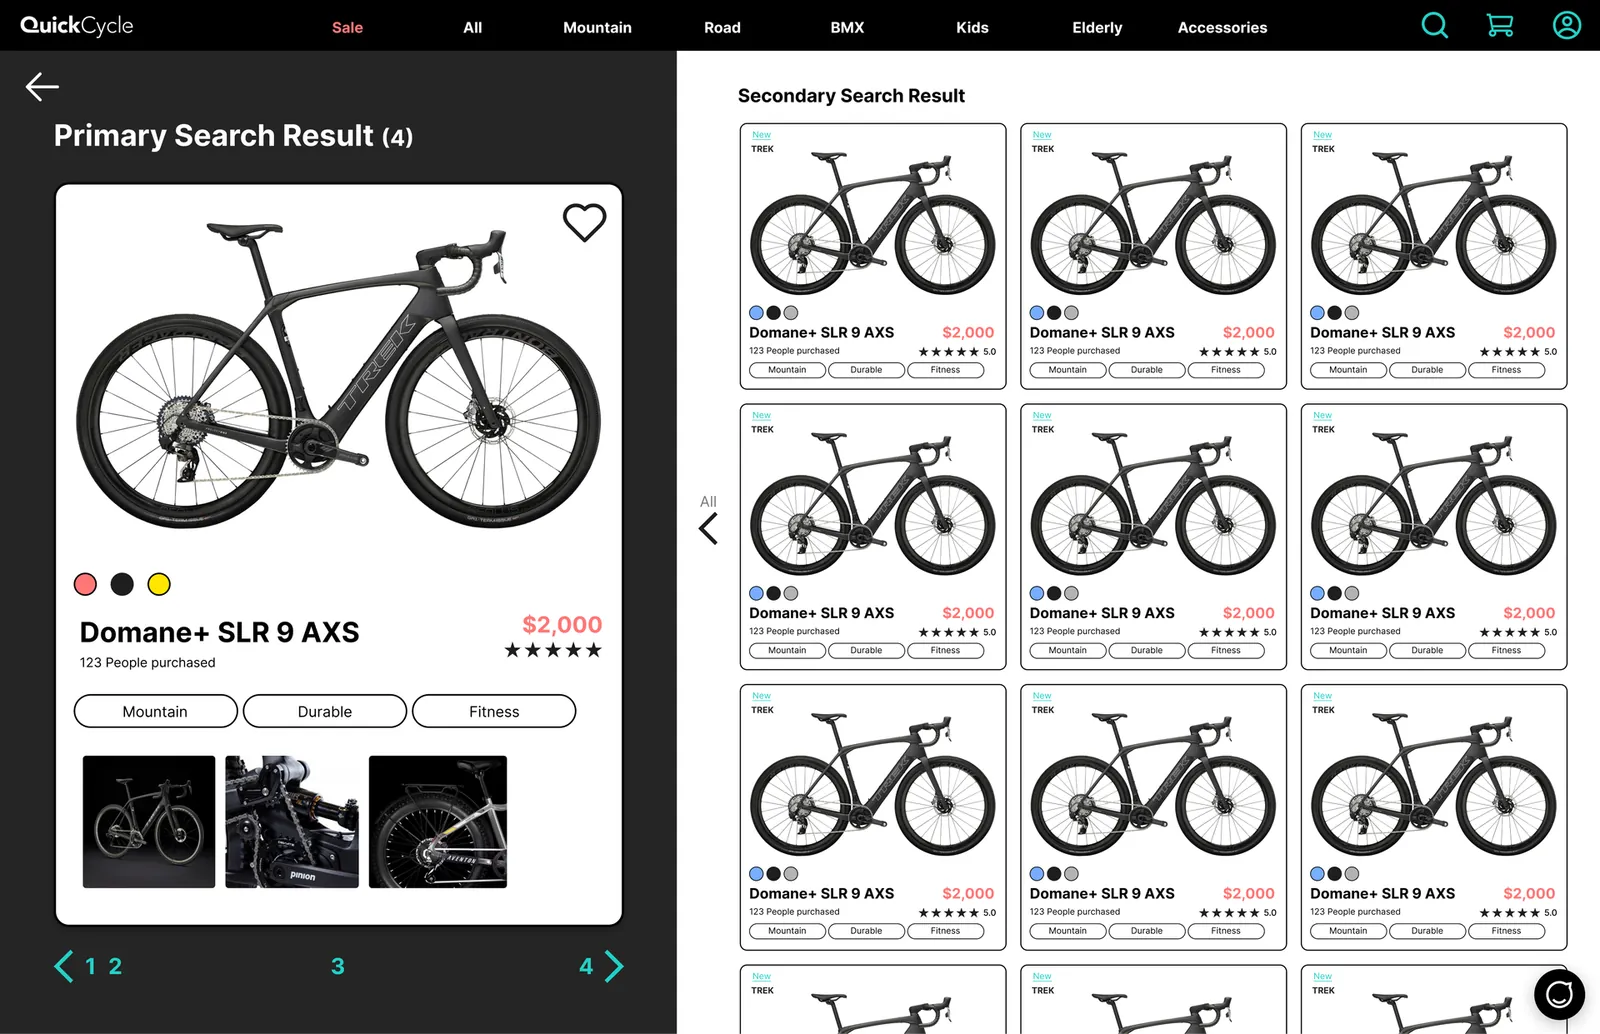
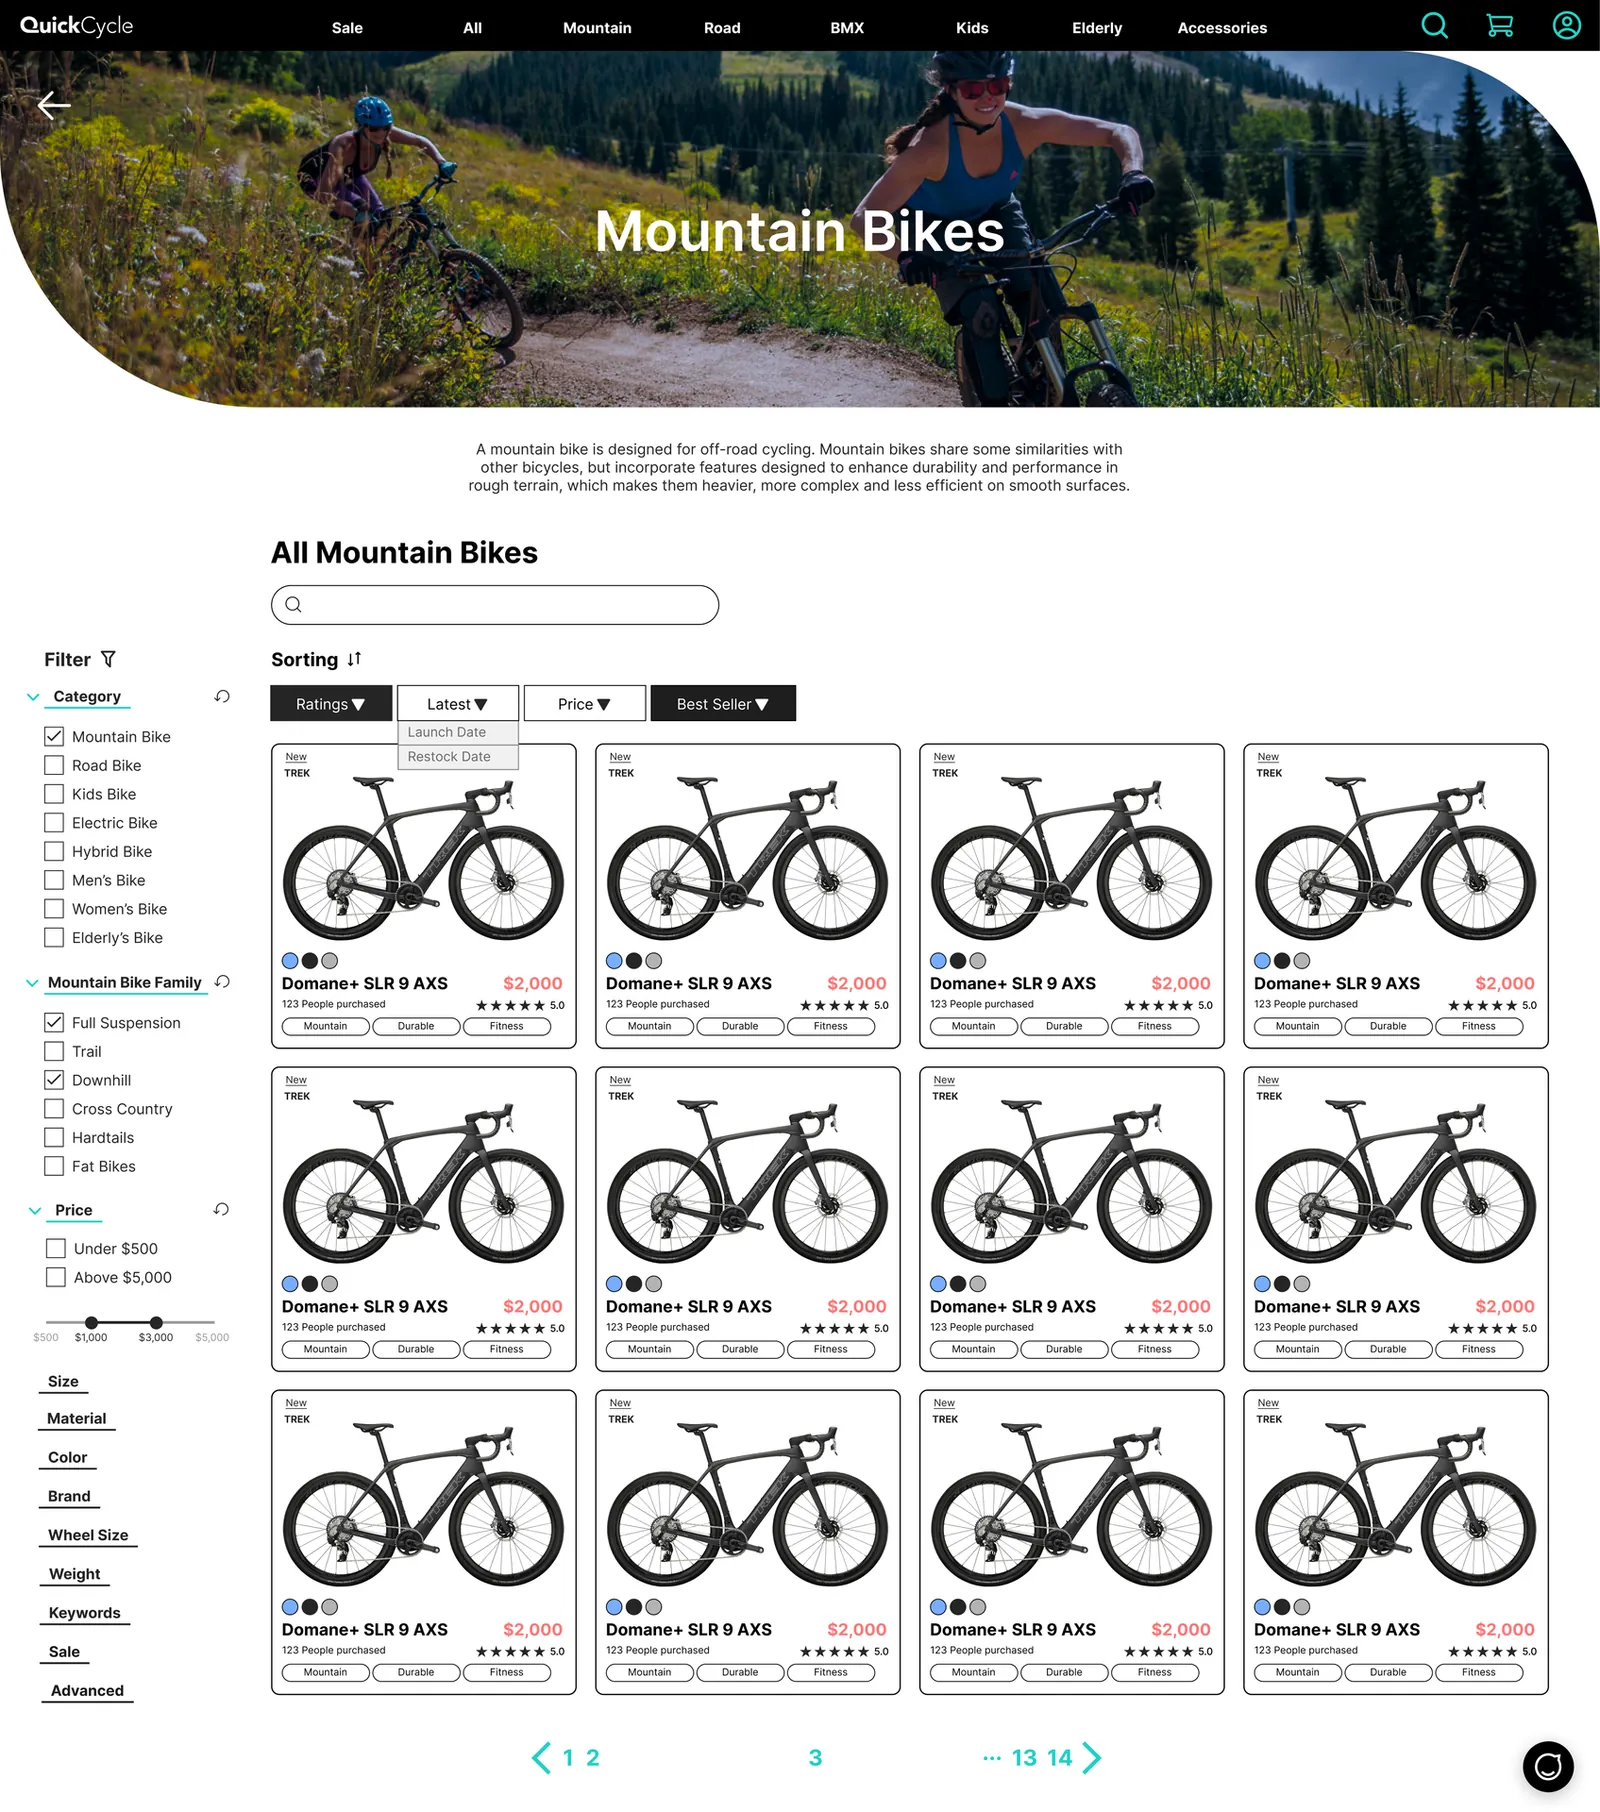
Product Recommendation Gallery
- Personalized results
- Product detail with keyword/tags
- Quick mark as favorite
- Swipe to view more products
- Bike chatbot
Product Detail
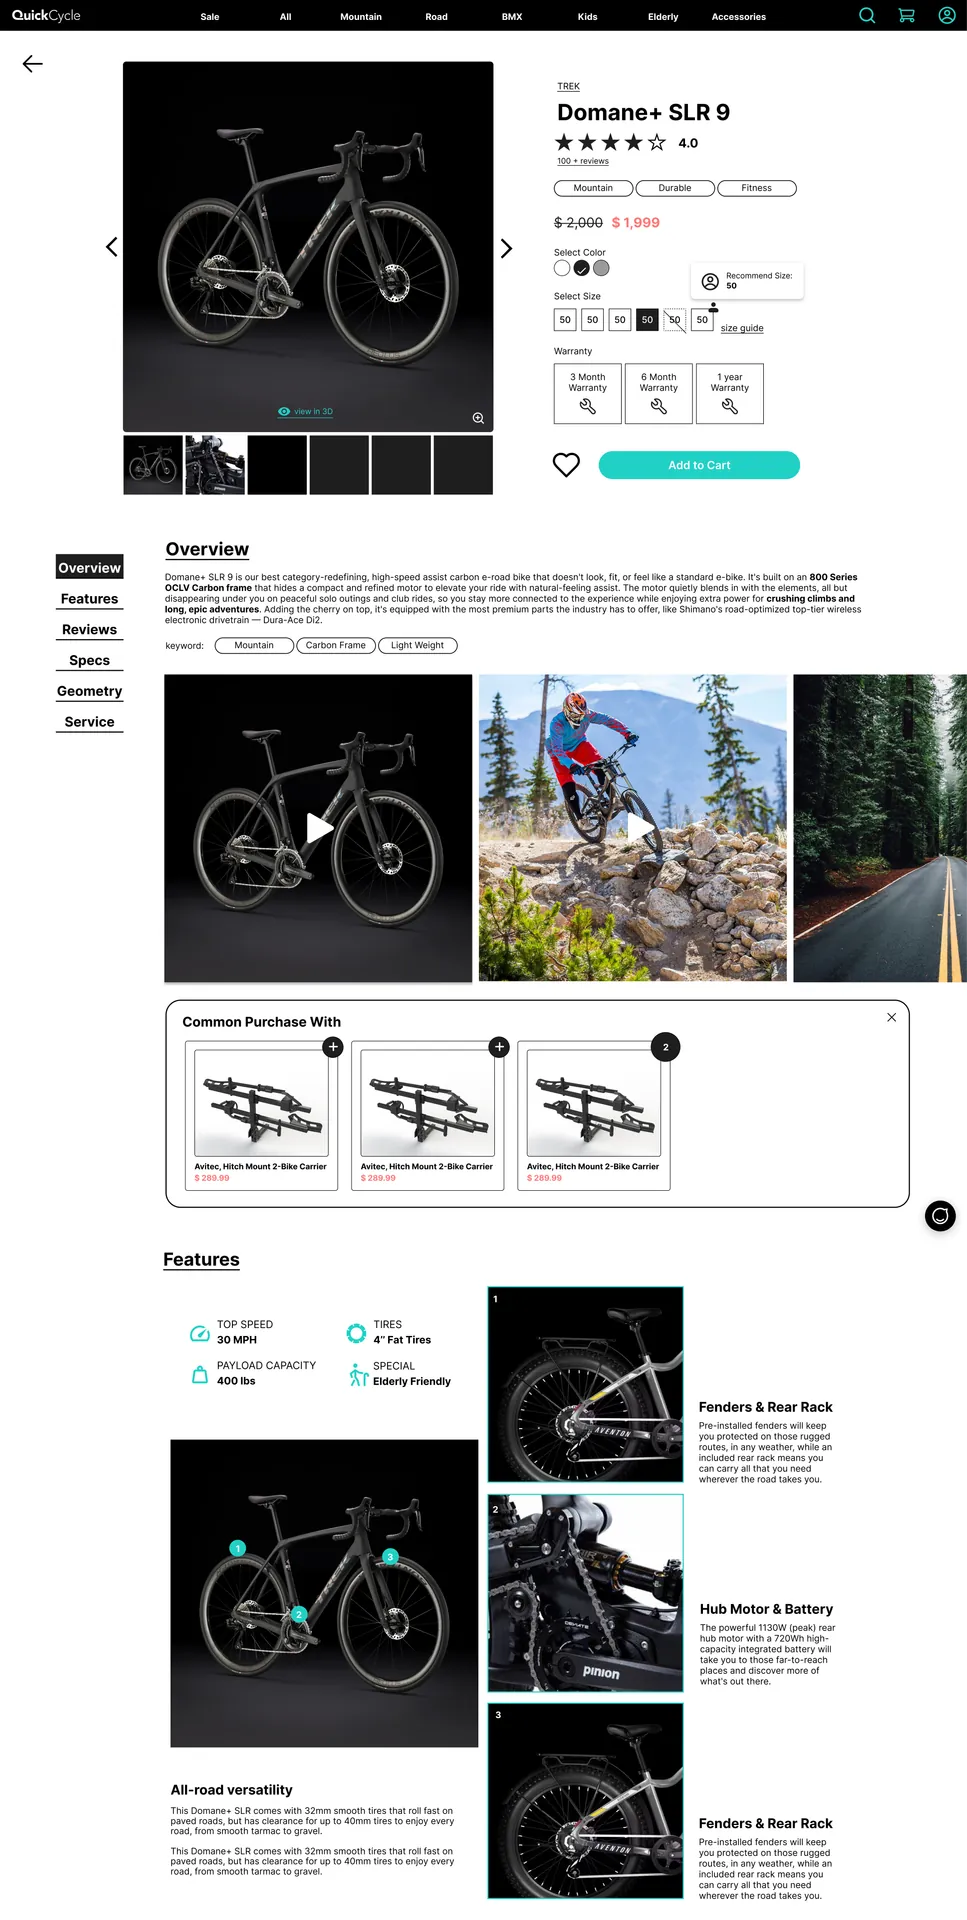
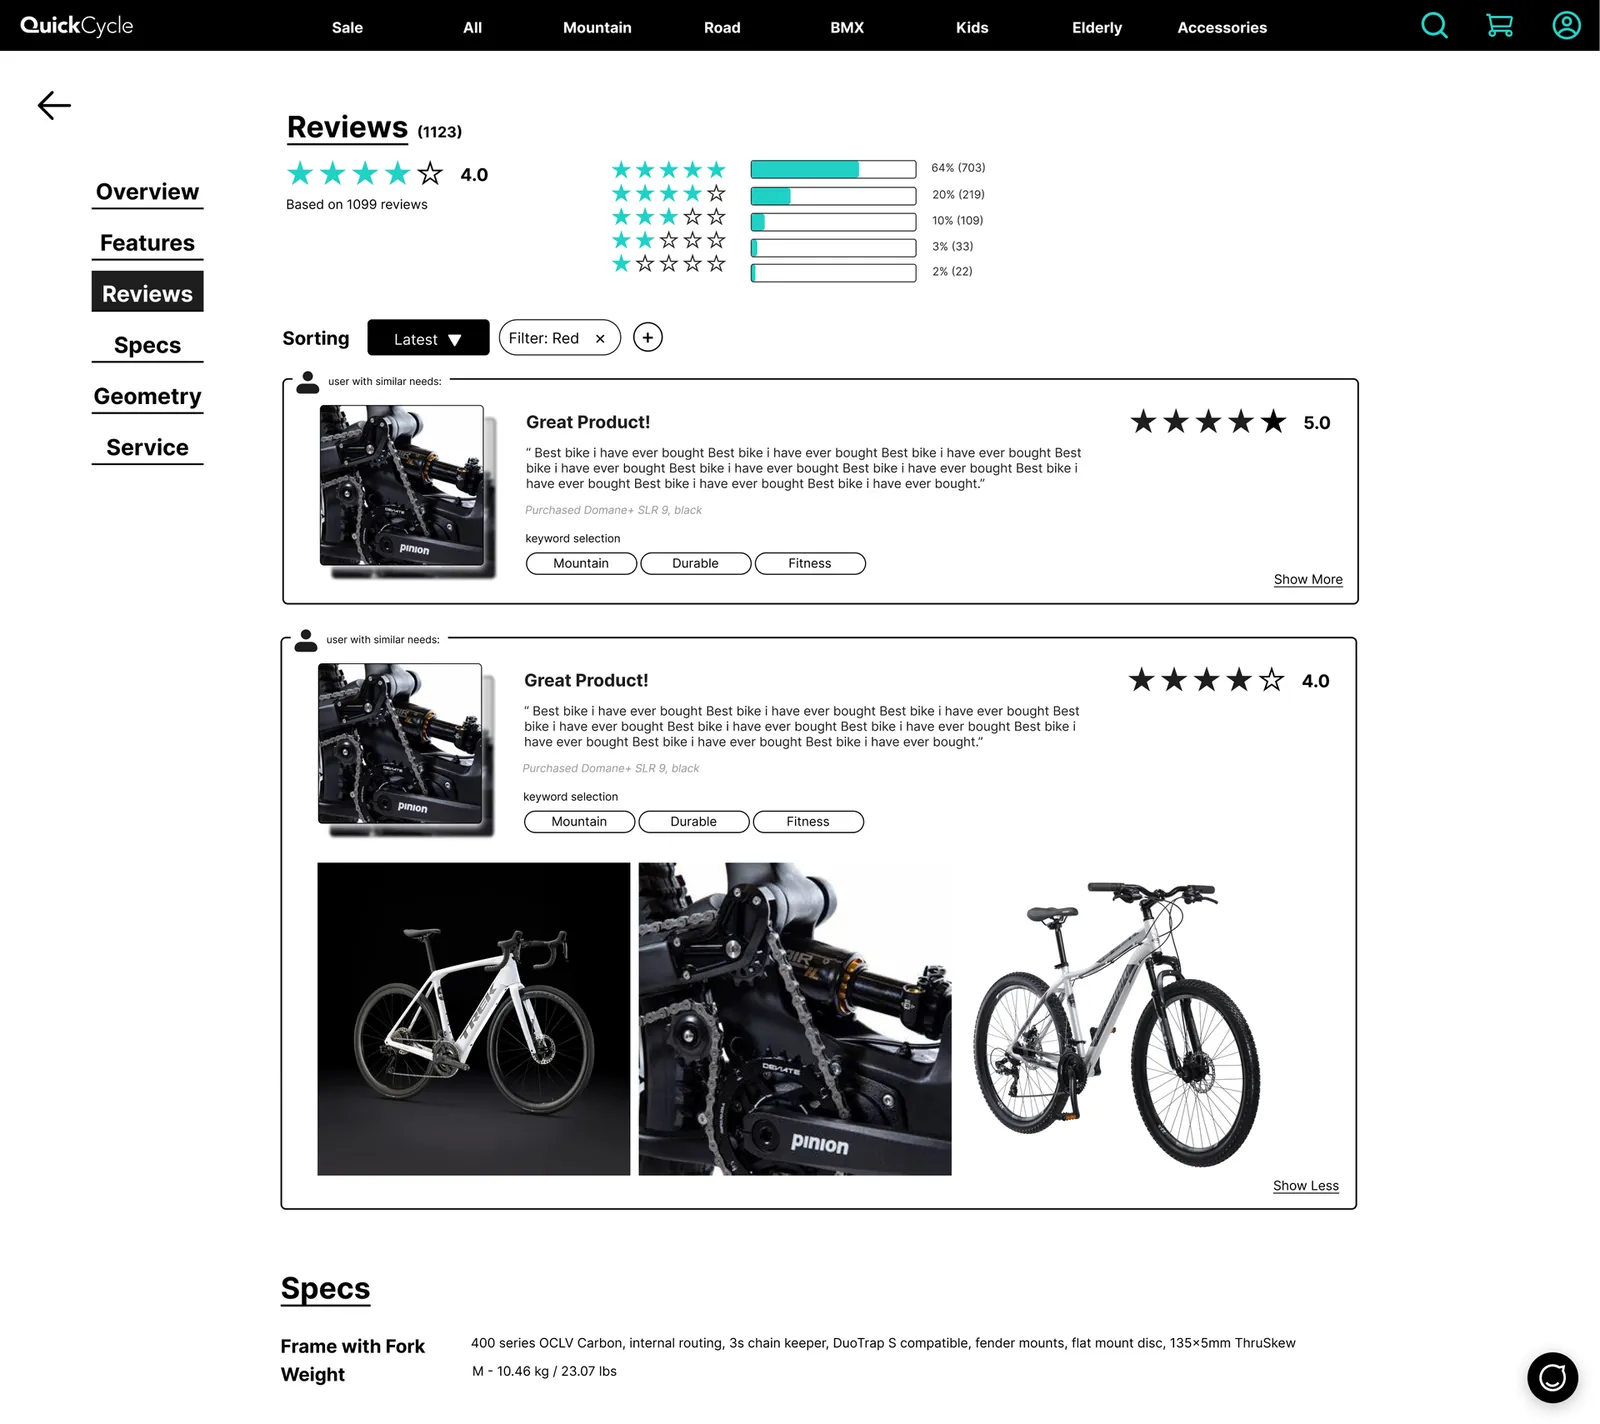
- Recommended size for individual customer
- View in 3D mode
- Selected keywords for customers to avoid reading heavy text
- Product closeup
- Reviews from customers with similar data and needs will be pushed to the front
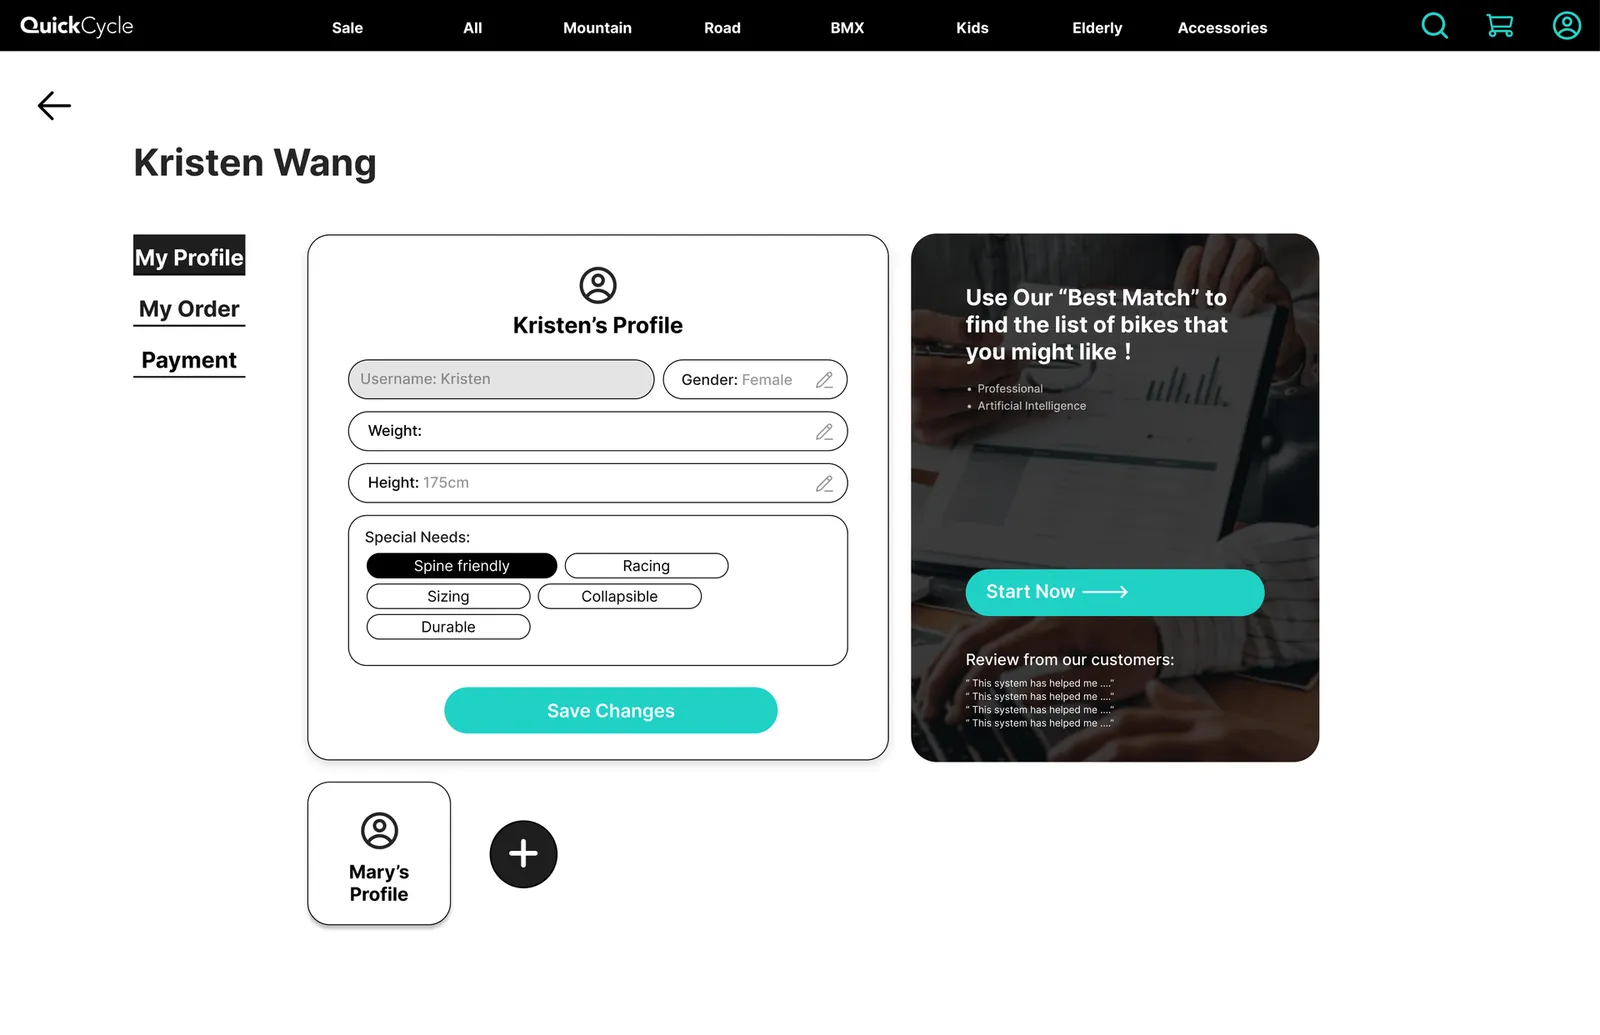
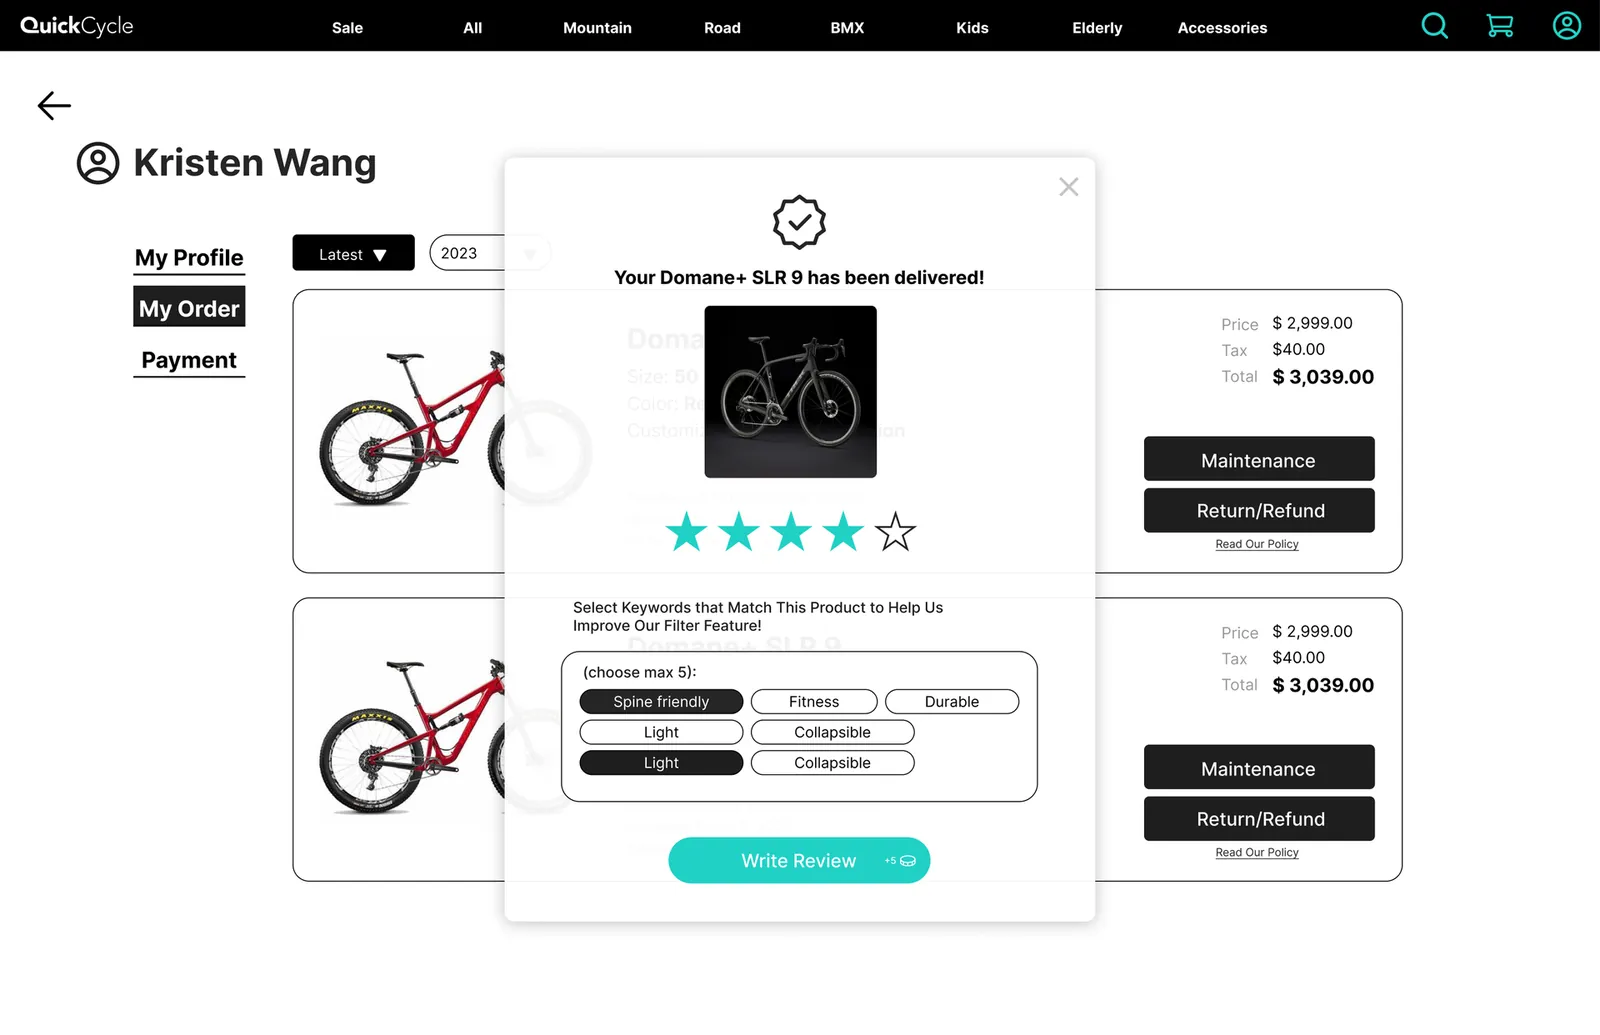
Profile & Feedback
- Easy edit profile data & survey
- Family profiles for other members
- Ratings & keyword selection for other customers
- Rewards available to encourage contribution
Impact
The design solutions significantly enhanced the user experience by addressing key pain points, including navigation complexity and unclear filtering and recommendation mechanisms. Post-launch usability testing showed a 32% reduction in time-to-find a product, a 25% increase in successful filter usage, and a 17% improvement in task completion rates for users searching for a specific bike type. Additionally, product discovery-related support queries decreased by 21%, indicating improved clarity and usability. As one peer noted, “The improved tagging and filtering system made finding the right bike much easier and more intuitive.”